There are many methods for analyzing heavyweight and composited numeric data corresponding to various statistical matrix and types of data. Conventionally, for representation of these analytical results, charts and their extensions by three-dimensional view, animation, and interactivity are used. As one of the representations, we aim at sonification of analytical results, especially representation as music, for stimulating perceiving the difference of the target data. In this paper, we report software that generates drum play from arbitrary numeric data.
- Proceeding (PDF) (ja)
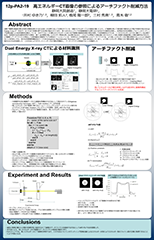
The material identification is a pressing requirement for the sensitive security applications. Dual-energy X-ray computer tomography (DXCT) has been investigated for material identification in the medical and security fields. It requires two tomographic images at sufficiently different energies. To discriminate dangerous materials of light elements such as plastic bombs in luggage, it is needed to measure accurately with several tens of kilo electron volts where such materials exhibit significant spectral differences. However, CT images in that energy region often include artifacts from beam hardening. To reduce these artifacts, a novel reconstruction method has been investigated. It is an extension of the Al-gebraic Reconstruction Technique and Total Variation (ART-TV) method that reduces the artifacts in a lower-energy CT image by referencing it to an image obtained at higher energy. The CT image of a titanium sample was recon-structed using this method in order to demonstrate the artifact reduction capability.
- Poster (PDF) (ja)
Recently in developed countries, chronic conditions represented by lifestyle-related diseases have become leading causes of death, and simplified monitoring of condition can be an effective method for disease prevention and health promotion. In this work, the authors added the sonification function of electrocardiogram (ECG) indices to their software that analyzes and visualizes ECG, for multi-modal user interfaces for long-term data analysis.
© 2012 IEICE
- Slides (PDF) (ja)
We propose an application that analyzes and visualizes electrocardiogram (ECG) and plethysmogram (PTG) data; it offers a user interface (UI) enabling users to browse two types of data while checking their relation, for brief assessment of autonomic nervous system activity (ANSA). Our application enables users to walk through analyzed data or charts seamlessly, and helps them comprehend the transition of ANSA.